Summary of Key Findings
Preventive care stands as the cornerstone of American health, delivering extraordinary returns on investment while saving lives and reducing chronic disease burden. Yet the United States faces unprecedented challenges: childhood vaccination rates have fallen below herd immunity thresholds for the first time in decades, cancer screening rates dropped 10 percentage points since 2020, and persistent health disparities leave millions of Americans without access to life-saving preventive services. Simultaneously, emerging technologies—artificial intelligence, wearable devices, and telehealth—are reshaping how Americans access and engage with preventive care.
This exhaustive guide synthesizes the latest data (2021-2025) from the CDC, National Cancer Institute, NIH, and dozens of authoritative sources to provide journalists, researchers, policymakers, and healthcare professionals with the most comprehensive preventive care statistics available. Every statistic links directly to its primary source, enabling verification and deeper exploration.
Key Takeaways
- 85.2% of U.S. adults[1] accessed healthcare in 2024, but significant gaps remain
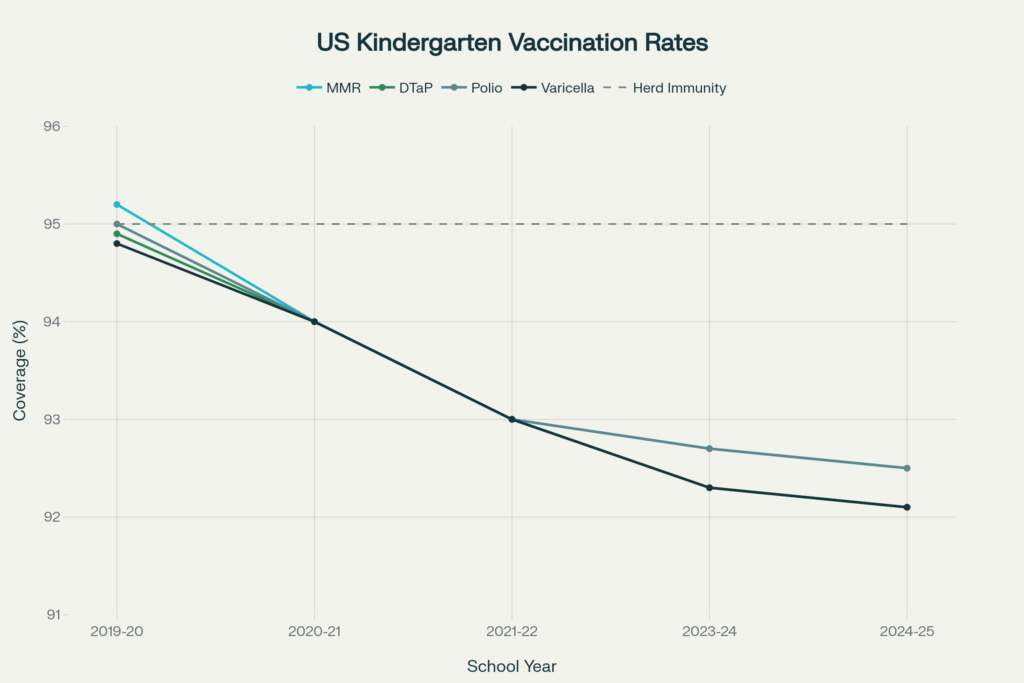
- Kindergarten vaccination rates[2] fell to 92.5% in 2024-25, below the 95% herd immunity threshold
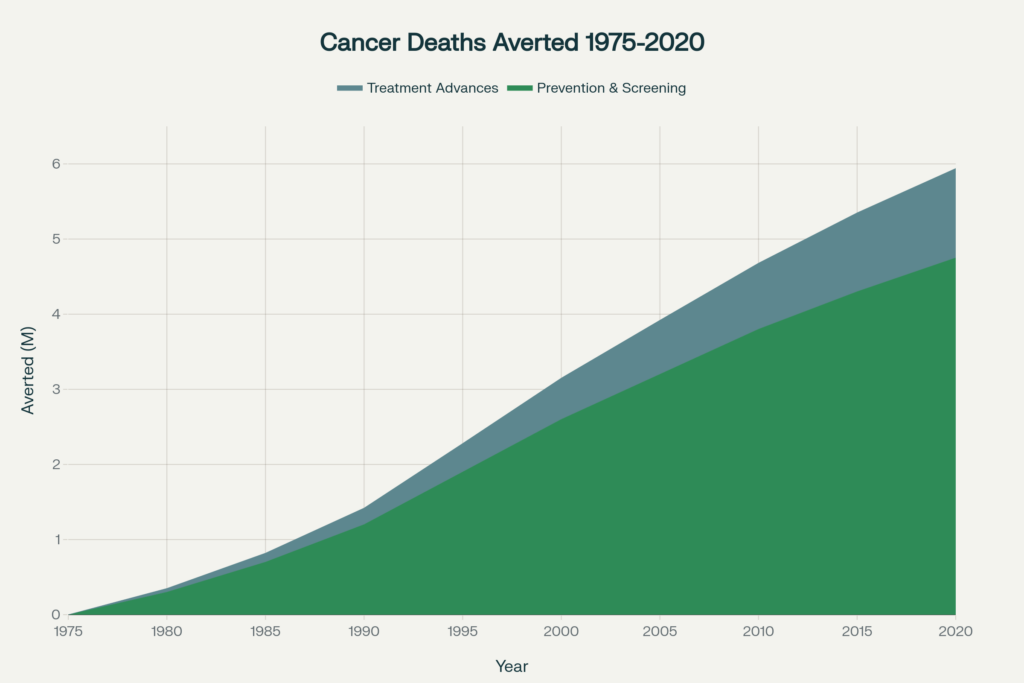
- Cancer screening prevented 4.75 million deaths[3] from 1975-2020, accounting for 80% of cancer deaths averted
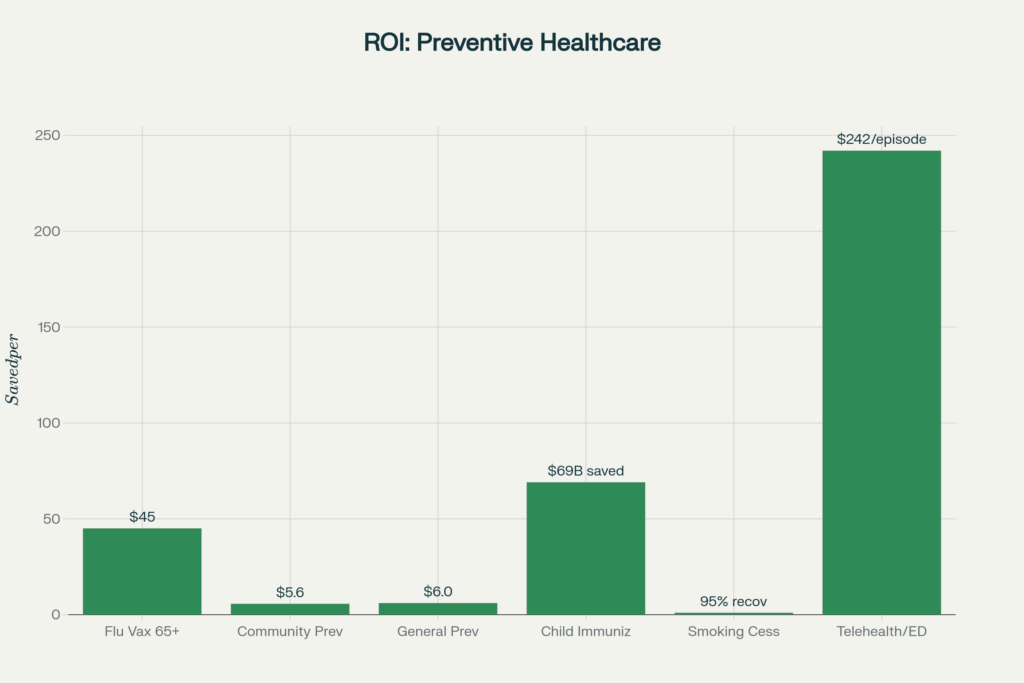
- Every $1 invested in prevention returns $5.60-$45[4] depending on the intervention
- 66% of physicians now use AI[5] in healthcare, up 78% from 2023
What is Preventive Care?
Preventive care encompasses healthcare services focused on preventing illness, detecting diseases early, and maintaining wellness through routine checkups, screenings, immunizations, and risk counseling. Healthy People 2030[6] defines preventive care as services that “help people get recommended preventive health care services” to reduce the risk of diseases, disabilities, and death.
The CDC’s National Center for Chronic Disease Prevention and Health Promotion[7] emphasizes that preventive care addresses both individual clinical services and population-level public health interventions. These services fall into three categories:
Primary Prevention: Prevents disease before it occurs (vaccinations, healthy diet, exercise)
Secondary Prevention: Detects and treats disease early (cancer screenings, blood pressure checks)
Tertiary Prevention: Manages existing disease to prevent complications (diabetes management, cardiac rehabilitation)
Preventive Care Access and Utilization
Overall Healthcare Access
The latest CDC National Health Interview Survey (NHIS) data[1] reveals that 85.2% of U.S. adults visited a healthcare professional in 2024, while children fared better at 95.1% access. However, these figures mask significant variations by demographics and insurance status.
Physician office visits[8] totaled over 1 billion annually in 2019, averaging 320.7 visits per 100 individuals nationally. Primary care physicians accounted for 50.3% of all visits, underscoring their critical role as the gateway to preventive services.
Post-Pandemic Recovery
A comprehensive JAMA Health Forum study analyzing 2019-2022 data[9] found that adult wellness visits rebounded to 98% of prepandemic levels by 2022. However, recovery varied dramatically by race and ethnicity:
- Non-Hispanic White adults: 99% recovery
- Hispanic adults: 97% recovery
- Black adults: 96% recovery
- Asian adults: Only 95% recovery, the slowest among all groups
Cost Barriers
Despite improvements in insurance coverage under the Affordable Care Act, cost remains a persistent barrier[9]. In 2022:
- 21% of adults delayed needed medical care due to cost
- 18% did not receive care at all due to financial concerns
- Both rates remain below prepandemic 2019 levels, indicating ongoing financial strain
The CDC’s analysis of preventive service usage[10] from 2018-2022 documented that nearly all preventive services experienced “health debt” during 2020, with utilization dropping 15-30% depending on the service. By 2022, most services had rebounded to 99%+ of 2019 levels, though some screenings lag behind.
Routine Checkups
According to the CDC’s PLACES data[11], routine checkup rates vary substantially:
- Adults 65+: 81.1 visits per 100 individuals
- Adults 45-64: 51.8 visits per 100 individuals
- Adults 18-44: 53.2 visits per 100 individuals
- Children under 18: 73.2 visits per 100 individuals
Gender disparities are particularly pronounced among working-age adults. According to CDC data[8]:
- Women aged 18-44: 87.1 visits per 100 individuals
- Men aged 18-44: 18.5 visits per 100 individuals
- Women are 4.7 times more likely to receive preventive care in this age group
Cancer Screening: Trends and Impact
Overall Screening Trends
Cancer screening represents one of preventive medicine’s greatest success stories, yet utilization remains suboptimal. The Prevent Cancer Foundation reported[12] that cancer screening rates dropped by 10 percentage points after 2020, with only 51% of adults 21+ receiving routine cancer screening or medical appointments in 2024, down from 61% in 2022.
Breast Cancer Screening
CDC data from 2023[13] shows that 79.8% of women aged 50-74 were up-to-date with breast cancer screening, approximating the Healthy People 2030 target of 80.5%[14]. This represents a modest increase from 76.2% in 2019.
Mammography utilization stands at 78% among age-eligible women, according to CDC’s 2023 analysis[15]. However, screening rates vary significantly by demographic factors:
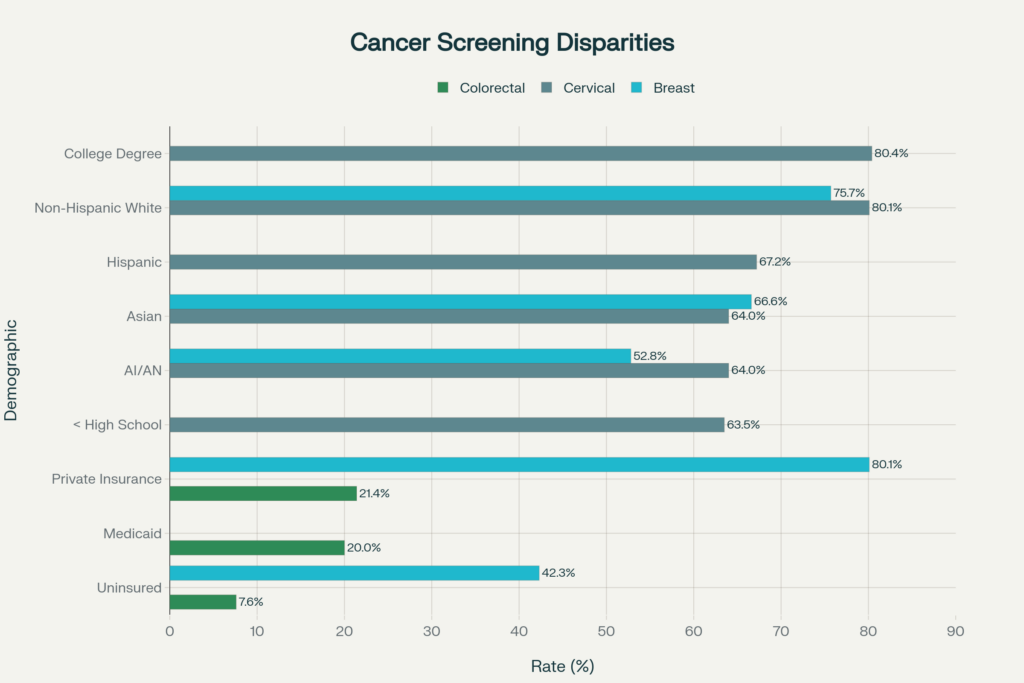
- Race/Ethnicity disparities (AACR Cancer Progress Report[16]):
- Non-Hispanic White women: 75.7% up-to-date
- Asian/Pacific Islander women: 66.6% (13.1% lower than White women)
- American Indian/Alaska Native women: 52.8% (lowest rate)
- Insurance status (CDC BRFSS data[17]):
- Private insurance: 80.1% screened
- Uninsured: 42.3% screened
- Privately insured women are 1.9 times more likely to receive screening
Cervical Cancer Screening
CDC’s 2023 NHIS analysis[18] found that 75.8% of women aged 21-65 were up-to-date with cervical cancer screening, falling short of the Healthy People 2030 target of 84.3%[19].
Pap/HPV testing rates in 2022 reached only 81% of prepandemic levels, according to the CDC’s pandemic impact analysis[10], representing one of the slowest recoveries among preventive services.
Demographic variations are substantial:
- Non-Hispanic White women: 80.1%
- Hispanic women: 67.2%
- Asian and AI/AN women: 64% each
- By education (CDC data[17]):
- College degree holders: 80.4%
- Less than high school: 63.5%
Colorectal Cancer Screening
Colorectal cancer screening presents perhaps the greatest opportunity for improvement. The CDC’s 2023 data[20] shows that 67.4% of adults aged 45-75 were up-to-date, well below the Healthy People 2030 target of 74.4%[21].
The newly eligible 45-49 age group shows alarmingly low uptake. A 2021 JNCI study[22] found that only 20% of adults aged 45-49 had been screened, despite the 2021 USPSTF guideline change[23] lowering the screening age from 50 to 45.
Among 45-49 year-olds who were screened:
- Colonoscopy: 17.8% had received this test
- Stool-based tests (FIT/FOBT): Only 2.4% used these lower-cost alternatives
Insurance disparities are stark (JNCI 2021[22]):
- Private insurance: 21.4% screened
- Medicaid: 20% screened
- Uninsured: 7.6% screened
- Privately insured individuals are 2.8 times more likely to be screened than uninsured
CDC’s 2023 analysis[24] found that colonoscopy/sigmoidoscopy use in 2022 was only 81% of prepandemic levels, indicating persistent pandemic-related disruptions.
Cancer Screening Impact on Mortality
The most comprehensive assessment of cancer screening’s impact comes from the NCI’s CISNET modeling study[25], which estimated that 5.94 million cancer deaths were averted in the United States from 1975-2020.
Prevention and screening accounted for 4.75 million deaths averted (80%), while treatment advances prevented 1.19 million deaths (20%). This 4:1 ratio demonstrates screening’s outsized impact on cancer mortality.
Breaking down by cancer type:
- Lung cancer prevention (smoking cessation): 3.45 million deaths averted (72% of total prevention impact)
- Colorectal cancer screening: 740,000 deaths averted through polyp detection and removal
- Cervical cancer screening: 160,000 deaths averted (nearly 100% from Pap/HPV testing)
- Breast cancer screening: 250,000 deaths averted from early detection
- Prostate cancer screening: 200,000 deaths averted
By contrast, treatment advances prevented:
- Breast cancer: 750,000 deaths (63% of treatment impact)
- Colorectal cancer: 200,000 deaths
- Other cancers: 240,000 deaths
These data underscore that prevention and early detection remain far more impactful than treatment for reducing cancer mortality at the population level.
Vaccination Coverage and Trends
Childhood Vaccination Decline
Perhaps no statistic better illustrates America’s preventive care crisis than the precipitous decline in childhood vaccination rates[26]. During the 2024-25 school year, kindergarten vaccination coverage fell below the critical 95% herd immunity threshold for all routinely recommended vaccines.
MMR (Measles, Mumps, Rubella) coverage:
- 2024-25: 92.5%
- 2023-24: 92.7%
- 2019-20 (prepandemic): 95.2%
- Decline: 2.7 percentage points below herd immunity threshold
Other vaccine coverage (2024-25):
- DTaP (Diphtheria, Tetanus, Pertussis): 92.1%
- Polio: 92.5%
- Varicella (Chickenpox): 92.1%
All four vaccines decreased in more than half of U.S. states compared to the previous year, according to CDC SchoolVaxView[26].
Vaccination Exemptions at Record High
Vaccine exemptions hit a record 3.6% nationally[26] in 2024-25, up from 3.3% the previous year and 2.5% in 2020-21. This represents a 44% increase in just four years.
State-level exemption data reveals concerning trends:
- 17 states now have exemption rates exceeding 5%
- Idaho leads with 15.4% exemptions (1 in 6 kindergartners)
- 39 states had MMR coverage below the 95% target (up from 28 states in 2019-20)
- 16 states fell below 90% MMR coverage (up from only 3 states in 2019-20)
The absolute numbers are staggering:
- 138,000 kindergartners were exempt from one or more vaccines in 2024-25
- 286,000 kindergartners lacked MMR documentation
- Combined, 424,000 children entered kindergarten potentially unprotected
Measles Resurgence
The vaccination decline has real-world consequences. CDC measles surveillance[27] documented 1,333 measles cases in 2025, the highest since measles was declared eliminated in 2000.
Among these cases:
- 92% of patients were unvaccinated or had unknown vaccination status
- 29% were children under age 5
- Multiple outbreaks occurred in communities with high exemption rates
A 2025 analysis published in Contemporary Pediatrics[28] quoted Dr. Tina Tan, president of the Infectious Diseases Society of America: “This is really terrible. It is a true indicator of the increase in vaccine hesitancy and anti-vaccination beliefs.”
Adult and Adolescent Vaccination
Adult vaccination rates remain suboptimal:
- Flu vaccination (2020-21 season): Only 52.8% of Americans aged 6 months+[29] received flu shots
- COVID-19 vaccination (2024-25): Coverage varies widely by demographics and political affiliation, with persistent pockets of low uptake[30]
Adolescent vaccination shows mixed results, with HPV vaccination[31] increasing but other vaccines plateauing.
Global Context
The U.S. decline mirrors global trends documented by WHO[32]. Global vaccination coverage dropped from 86% in 2019 to 81% in 2021, leaving millions of children vulnerable. However, most high-income countries have recovered faster than the United States, making America’s continued decline particularly concerning.
Economic Impact of Prevention
Healthcare Cost Burden
Chronic diseases account for 75% of America’s $4.3 trillion healthcare spending[33], with preventable chronic diseases alone costing $3.7 trillion annually[7], according to CDC estimates.
Yet the United States allocates only 5% of healthcare spending to prevention, with 95% going to treatment of established disease, as documented in HHS analyses[34].
Return on Investment
The economic case for prevention is overwhelming. The seminal 2008 Trust for America’s Health study[35] found that an investment of $10 per person per year in community-based prevention programs could save $16 billion annually within 5 years, a return of $5.60 for every $1 invested.
This conservative estimate includes only direct medical savings, excluding productivity gains, reduced absenteeism, and quality of life improvements.
Breakdown of savings:
- Medicare: $5 billion saved annually
- Medicaid: $1.9 billion saved annually
- Private payers: $9 billion saved annually
Timeframe for returns:
- 1-2 years: $2.8 billion saved (ROI of 0.96:1)
- 5 years: $16.5 billion saved (ROI of 5.6:1)
- 10-20 years: $18.5 billion saved (ROI of 6.2:1)
Intervention-Specific ROI
Different preventive interventions show varying returns:
Flu vaccination for adults 65+:
Canadian health system data documented in multiple studies[36] shows $45 saved for every $1 spent on senior flu vaccination through reduced hospitalizations and complications.
Childhood immunizations:
CDC analyses[37] estimate that routine childhood immunizations save $69 billion in direct healthcare costs over vaccinated children’s lifetimes, plus $381 billion in societal costs including productivity losses.
Telehealth for ED diversion:
A 2020 Anthem study[38] found that diverting emergency department visits to telehealth saved $242 per episode, a reduction of approximately 6% in total care costs.
Smoking cessation programs:
CDC estimates[39] show that every dollar spent on smoking cessation yields $3-$7 in healthcare savings, primarily through reduced lung cancer, heart disease, and COPD incidence.
Productivity and Economic Output
Beyond direct healthcare savings, preventable illness carries enormous indirect costs. Economic analyses[40] estimate that $260 billion in annual economic output is lost due to illness-related missed workdays attributable to preventable chronic diseases.
A 2024 JAMA Health Forum analysis[41] examined whether prevention saves money at scale. While some high-cost interventions don’t generate positive ROI, community-based prevention programs consistently deliver substantial returns, particularly when targeted at high-risk populations.
Health Disparities in Preventive Care
Racial and Ethnic Disparities
The American Cancer Society’s 2023 disparities report[42] and CDC BRFSS data[17] document persistent and substantial disparities in cancer screening rates:
Breast Cancer Screening (Women 50-74):
| Demographic Group | Screening Rate | Disparity vs. Baseline |
|---|---|---|
| Non-Hispanic White | 75.7% | Baseline |
| Asian/Pacific Islander | 66.6% | -13.1% |
| American Indian/Alaska Native | 52.8% | -30.2% |
| Private Insurance | 80.1% | +5.8% |
| Uninsured | 42.3% | -44.1% |
Cervical Cancer Screening (Women 21-65):
| Demographic Group | Screening Rate | Disparity vs. Baseline |
|---|---|---|
| Non-Hispanic White | 80.1% | Baseline |
| College Degree | 80.4% | +0.4% |
| Hispanic | 67.2% | -16.1% |
| Asian | 64.0% | -20.1% |
| AI/AN | 64.0% | -20.1% |
| Less than High School | 63.5% | -20.7% |
Colorectal Cancer Screening (Adults 45+):
| Demographic Group | Screening Rate | Disparity vs. Baseline |
|---|---|---|
| Private Insurance | 21.4% | Baseline |
| Medicaid | 20.0% | -6.5% |
| Uninsured | 7.6% | -64.5% |
Insurance Status as Primary Driver
A comprehensive 2024 JAMA Network Open study[43] analyzed 1.5 million preventive care encounters and found that insurance status was the strongest predictor of screening access, even after controlling for race, income, and education.
Key findings:
- Lowest-income patients had 43% higher odds of claim denial than highest-income patients
- Asian, Hispanic, and Black patients had 2-3 times higher denial rates than White patients
- Patients with less than high school education had 57% higher denial rates than college graduates
Geographic Disparities
The California Health Care Foundation’s 2024 Health Disparities Almanac[44] and CDC PLACES data[11] reveal substantial geographic variations:
Rural vs. Urban:
- Rural Texas Black/Hispanic women were 22-33% less likely to use mammography than urban counterparts
- Colorectal cancer mortality rates were 23% higher in nonmetropolitan areas than large metro areas
- Access to preventive services was consistently lower in Appalachia, the rural South, and tribal lands
State-level variations in preventive service utilization span a 2-3 fold range for most services, driven by Medicaid expansion status, insurance coverage rates, and provider availability.
Disparities in Post-Pandemic Recovery
The 2024 JAMA Health Forum analysis[45] of preventive care recovery found that racial and ethnic minorities experienced slower rebounds in screening rates:
Wellness visit recovery (2022 vs. 2019):
- Non-Hispanic White adults: 99% recovered
- Hispanic adults: 97% recovered
- Black adults: 96% recovered
- Asian adults: 95% recovered
These persistent gaps, if not addressed, threaten to widen existing health equity gaps in cancer and chronic disease outcomes over the coming decade.
Social Determinants of Health
A 2024 JAMA study on social risk factors[46] found that patients with multiple social risk factor domains (housing instability, food insecurity, transportation barriers) had 40-60% lower odds of receiving recommended preventive services, independent of insurance coverage.
Emerging Technology: AI, Wearables & Telehealth
Artificial Intelligence in Preventive Care
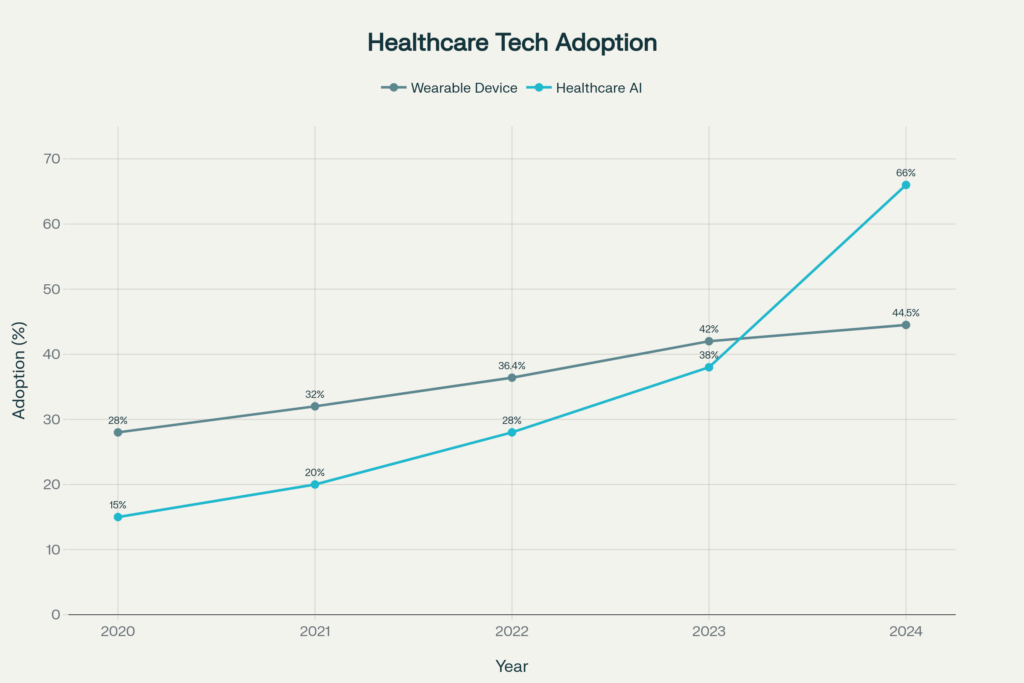
The 2024 American Medical Association survey[5] documented explosive growth in healthcare AI adoption:
- 66% of U.S. physicians reported using some form of healthcare AI in 2024
- 38% used AI in 2023, representing a 78% year-over-year increase
- 68% of physicians recognize AI benefits for patient care
- 57% believe AI can reduce administrative burdens, particularly documentation
However, public trust lags behind professional adoption. Pew Research data[47] shows that 60% of Americans would be uncomfortable if their healthcare provider relied heavily on AI for diagnosis and treatment decisions.
CDC announced in 2024[48] plans to integrate AI into public health surveillance and preventive service delivery, with particular focus on identifying high-risk populations for targeted interventions.
Wearable Health Technology
Wearable device adoption has accelerated dramatically:
Overall ownership trends:
- 2024: 44.5% of U.S. adults own at least one health wearable
- 2022: 36.4% ownership (JMIR study[49])
- 2020: 28-30% ownership (baseline)
- Growth rate: 11 percentage points in just 4 years
Demographics of wearable use (NCI Health Information National Trends Survey[50]):
- Ages 18-34: 10.2% use health trackers regularly
- Ages 50-64: 7.93% regular use
- Ages 65-74: 2.0% regular use (lowest adoption)
- Female users: 16.41% vs. Male users: 13.54%
Clinical integration:
A 2023 NHLBI study[51] found that >80% of wearable users are willing to share their data with healthcare providers, yet only 38% of adults with cardiovascular disease use wearables regularly despite their potential benefit.
Physician attitudes:
Industry surveys[52] indicate that 88% of physicians want patients to monitor their health at home using wearables, viewing them as valuable for chronic disease management and early warning of health changes.
A 2024 Deloitte analysis[52] projects that wearable integration into preventive care protocols could reduce hospitalizations by 8-12% among chronic disease patients through early intervention.
Telehealth Transformation
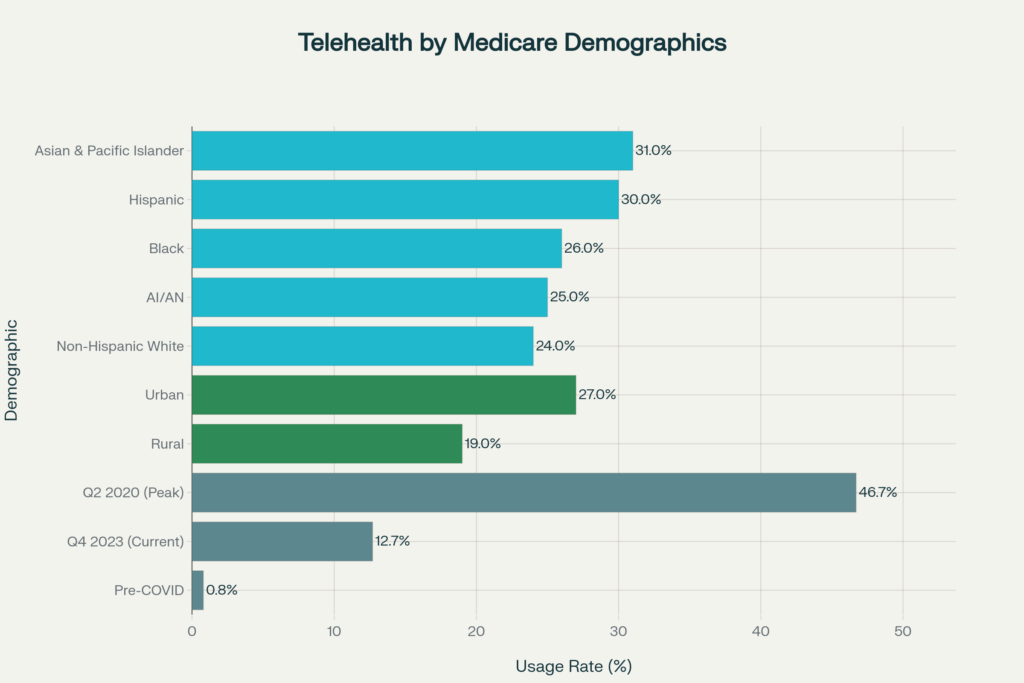
The COVID-19 pandemic permanently transformed telehealth utilization. HHS ASPE data[53] shows:
Medicare beneficiary telehealth use:
- Pre-COVID (2019): <1% used telehealth
- Peak pandemic (Q2 2020): 46.7% used telehealth (nearly half of all primary care visits)
- Current (Q4 2023): 12.7% use telehealth
- Stabilization: Use has plateaued at 10-13 times prepandemic levels
Demographic patterns in telehealth (KFF analysis[53]):
By Race/Ethnicity (Medicare beneficiaries, 2023):
- Asian & Pacific Islander: 31% use telehealth
- Hispanic: 30%
- Black: 26%
- AI/AN: 25%
- Non-Hispanic White: 24%
By Geography:
- Urban areas: 27% use telehealth
- Rural areas: 19% use telehealth
- Digital divide: Rural residents 30% less likely to access telehealth
Clinical effectiveness and cost savings:
A 2020 NCQA analysis[54] found that telehealth did not increase total visit volume—instead serving as a substitute for in-person care. However, benefits include:
- 67-70% of telehealth users would have otherwise visited emergency departments or urgent care (multiple health system studies[38])
- $242 average savings per episode when ED visits are diverted to telehealth
- 17% lower total healthcare costs for telehealth users vs. non-users (Cigna study)
- 36% reduction in ED visits per 1,000 members using telehealth
Behavioral health applications:
Telehealth shows particular promise for mental health and substance use treatment:
- No-show rates for telehealth behavioral health: 4.4-7.26%
- No-show rates for in-person appointments: 19-22%
- 4-fold reduction in missed appointments improves continuity of care
Medicare travel savings:
CMS projects[55] that telehealth saved Medicare beneficiaries $100 million in travel costs in 2024, with particularly high impact in rural and frontier areas.
Chronic Disease Prevention
Chronic Disease Burden
CDC data[56] reveals that 6 in 10 U.S. adults (60%) have at least one chronic disease, while 4 in 10 have two or more chronic conditions. This burden drives the majority of healthcare utilization and costs.
Global Noncommunicable Disease Impact
WHO’s 2021 data[57] documents that 43 million deaths globally were attributed to noncommunicable diseases (NCDs):
- Cardiovascular diseases: 19 million deaths (44% of NCD deaths)
- Cancers: 10 million deaths (23%)
- Chronic respiratory diseases: 4 million deaths (9%)
- Diabetes (including kidney disease): >2 million deaths (5%)
Premature mortality:
Of 43 million NCD deaths, 18 million were premature (occurring before age 70), with 82% of these premature deaths occurring in low- and middle-income countries.
Four disease groups account for 80% of all premature NCD deaths, making them the primary targets for prevention efforts.
Preventability
WHO estimates[57] that 30-50% of cancers could be prevented through:
- Tobacco control
- Healthy diet and physical activity
- Limiting alcohol consumption
- Recommended screenings and vaccinations
A 2024 CDC analysis[58] found that five high-priority preventive services could avert 100,000 U.S. deaths annually:
- Tobacco cessation counseling and medication
- Colorectal cancer screening
- Breast cancer screening
- Hypertension screening and control
- Aspirin for cardiovascular disease prevention (in select populations)
Economic Impact of Chronic Disease
The NIHCM Foundation estimates[40] that chronic disease-related productivity losses cost the U.S. economy $260 billion annually through:
- Missed workdays
- Reduced productivity while working (presenteeism)
- Premature mortality and disability
- Caregiver burden
Potential for Mortality Reduction
The National Cancer Institute’s CISNET modeling[25] demonstrates that combining screening and treatment advances could reduce cancer death rates by an additional 29% if all eligible Americans received recommended screenings and evidence-based treatment.
For other chronic diseases, CDC models[7] project that achieving Healthy People 2030 targets for physical activity, nutrition, tobacco cessation, and screenings could reduce:
- Heart disease deaths: 20-25%
- Stroke deaths: 15-20%
- Type 2 diabetes incidence: 30-40%
- COPD hospitalizations: 15-20%
State-Level Variations
Vaccination Coverage by State
CDC SchoolVaxView data[26] reveals enormous state-to-state variations in 2024-25:
Highest MMR coverage:
- California: 96.1% (exemption rate: 0.1%, medical only)
- Connecticut: 98.2%
- Maine: 97.6%
- Maryland: 96.4%
Lowest MMR coverage:
- Idaho: 78.5% (exemption rate: 15.4%)
- Alaska: 81.2% (exemption rate: 9.4%)
- Arizona: 88.6% (exemption rate: 9.1%)
States with concerning trends:
- 39 states now below 95% MMR coverage (up from 28 in 2019-20)
- 16 states below 90% MMR coverage (up from 3 in 2019-20)
- 17 states have exemption rates exceeding 5%
Cancer Screening State Variations
CDC PLACES data[11] tracks preventive service utilization at county and census tract levels, revealing dramatic geographic variations:
Colorectal cancer screening (adults 50-75):
- Highest: Massachusetts, Rhode Island, Connecticut (>75% screened)
- Lowest: Wyoming, Montana, Mississippi (<60% screened)
- Urban-rural gap: Metropolitan areas average 5-8 percentage points higher screening
Breast cancer screening (women 50-74):
- Highest: Vermont, Massachusetts, Maine (>85% screened)
- Lowest: Oklahoma, Arkansas, Nevada (<73% screened)
Cervical cancer screening (women 21-65):
- Highest: Vermont, New Hampshire, Massachusetts (>85% screened)
- Lowest: Oklahoma, Idaho, Wyoming (<70% screened)
Drivers of State Variations
Key factors explaining state differences:
- Medicaid expansion status (expanded states show 8-12% higher screening rates)
- State vaccination laws (medical-only exemption states have 5-8% higher coverage)
- Provider density (states with more primary care physicians per capita have higher screening)
- Insurance coverage rates (strongly correlated with preventive service use)
- State health department funding (per capita public health funding predicts outcomes)
Conclusion
Preventive care stands at a crossroads. America possesses the knowledge, technology, and resources to prevent millions of deaths and hundreds of billions in healthcare costs through evidence-based preventive services. Yet vaccination rates have fallen to dangerous levels, screening rates lag behind targets, and profound disparities leave entire populations without access to life-saving care.
The statistics compiled in this guide paint a picture of both crisis and opportunity. Crisis in declining childhood vaccination that threatens herd immunity. Crisis in screening gaps that will manifest as late-stage cancers in coming years. Crisis in persistent disparities that violate principles of health equity.
But also opportunity. Opportunity in emerging technologies that can democratize access to preventive care. Opportunity in proven interventions that deliver 5-45 fold returns on investment. Opportunity to close gaps through targeted policy interventions and community-based programs.
The path forward requires sustained commitment from policymakers, healthcare systems, public health agencies, and individuals. By tracking these statistics rigorously, identifying gaps transparently, and implementing evidence-based solutions systematically, America can fulfill the promise of preventive medicine: keeping people healthy rather than merely treating disease.
This resource will continue tracking America’s progress—or regression—toward that goal, updating quarterly to hold the healthcare system accountable and illuminate the path toward health equity and optimal population health.
References
- 85.2% of U.S. adults. https://www.cdc.gov/nchs/nhis/index.htm Accessed November 8, 2025
- Vaccination Coverage and Exemptions among Kindergartners | SchoolVaxView. http://cdc.gov/schoolvaxview/data/index.html Accessed November 8, 2025
- Prevention and screening drive drop in cancer deaths. https://www.nih.gov/news-events/nih-research-matters/prevention-screening-drive-drop-cancer-deaths Accessed November 8, 2025
- Every $1 invested in prevention returns $5.60-$45. https://www.tfah.org/wp-content/uploads/archive/reports/prevention08/Prevention08Exec.pdf Accessed November 8, 2025
- 2 in 3 physicians are using health AI—up 78% from 2023. https://www.ama-assn.org/practice-management/digital/2-3-physicians-are-using-health-ai-78-2023 Accessed November 8, 2025
- Preventive Care. https://health.gov/healthypeople/objectives-and-data/browse-objectives/preventive-care Accessed November 8, 2025
- Chronic Disease | Chronic Disease. https://www.cdc.gov/chronicdisease/index.htm Accessed November 8, 2025
- FastStats. https://www.cdc.gov/nchs/fastats/physician-visits.htm Accessed November 8, 2025
- Just a moment.... https://jamanetwork.com/journals/jama-health-forum/fullarticle/2814606 Accessed November 8, 2025
- Preventive Service Usage and New Chronic Disease Diagnoses: Using PCORnet Data to Identify Emerging Trends, United States, 2018–2022. https://www.cdc.gov/pcd/issues/2024/23_0415.htm Accessed November 8, 2025
- About PLACES: Local Data for Better Health | PLACES. https://www.cdc.gov/places/about/index.html Accessed November 8, 2025
- Survey: Routine cancer screenings head in the wrong direction. https://preventcancer.org/news/routine-screenings-wrong-direction Accessed November 8, 2025
- Drink Tap: A Multisector Program to Promote Water Access and Intake in San Francisco Parks. https://www.cdc.gov/pcd/issues/2023/23_0007.htm Accessed November 8, 2025
- Increase the proportion of females who get screened for breast cancer — C‑05. https://health.gov/healthypeople/objectives-and-data/browse-objectives/cancer/increase-proportion-females-who-get-screened-breast-cancer-c-05 Accessed November 8, 2025
- FastStats. https://www.cdc.gov/nchs/fastats/mammography.htm Accessed November 8, 2025
- AACR Cancer Disparities Progress Report 2024. https://cancerprogressreport.aacr.org/disparities/ Accessed November 8, 2025
- Behavioral Risk Factor Surveillance System. https://www.cdc.gov/brfss/index.html Accessed November 8, 2025
- Use of Cancer Screening Tests, United States, 2023. https://www.cdc.gov/pcd/issues/2025/25_0139.htm Accessed November 8, 2025
- Increase the proportion of females who get screened for cervical cancer — C‑09. https://health.gov/healthypeople/objectives-and-data/browse-objectives/cancer/increase-proportion-females-who-get-screened-cervical-cancer-c-09 Accessed November 8, 2025
- Aerobic Exercise: Randomized Controlled Trial Data Suggest Qualified Benefits for Erectile Dysfunction. https://pubmed.ncbi.nlm.nih.gov/39093624/ Accessed November 8, 2025
- Increase the proportion of adults who get screened for colorectal cancer — C‑07. https://health.gov/healthypeople/objectives-and-data/browse-objectives/cancer/increase-proportion-adults-who-get-screened-colorectal-cancer-c-07 Accessed November 8, 2025
- Just a moment.... https://academic.oup.com/jnci/article/113/10/1330/6256448 Accessed November 8, 2025
- Recommendation: Colorectal Cancer: Screening. https://www.uspreventiveservicestaskforce.org/uspstf/recommendation/colorectal-cancer-screening Accessed November 8, 2025
- Page Not Found. https://www.cdc.gov/pcd/issues/2025/25_0091.htm Accessed November 8, 2025
- Page Not Found. https://www.cancer.gov/news-events/press-releases/2024/cancer-deaths-averted-screening-treatment Accessed November 8, 2025
- Page Not Found. https://www.cdc.gov/vaccines/imz-managers/coverage/schoolvaxview/index.html Accessed November 8, 2025
- Measles Cases and Outbreaks | Measles (Rubeola). https://www.cdc.gov/measles/data-research/index.html Accessed November 8, 2025
- CDC: Kindergarten vaccination decreases, exemptions increase . https://www.contemporarypediatrics.com/view/cdc-kindergarten-vaccination-decreases-exemptions-increase Accessed November 8, 2025
- Page Not Found. https://www.cdc.gov/flu/fluvaxview/index.htm Accessed November 8, 2025
- CDT Redirect Page. https://covid.cdc.gov/covid-data-tracker Accessed November 8, 2025
- Page Not Found. https://www.cdc.gov/vaccines/imz-managers/coverage/teenvaxview/index.html Accessed November 8, 2025
- 404. https://www.who.int/news/item/15-07-2022-covid-19-pandemic-leads-to-major-backsliding-on-childhood-vaccinations-new-who-unicef-data-shows Accessed November 8, 2025
- Page Not Found. https://www.cdc.gov/chronicdisease/about/costs/index.htm Accessed November 8, 2025
- Strategic Plan. https://www.hhs.gov/about/strategic-plan/index.html Accessed November 8, 2025
- Page not found. https://www.tfah.org/report-details/prevention-for-a-healthier-america-investments-in-disease-prevention-yield-significant-savings-stronger-communities/ Accessed November 8, 2025
- Treatment of Pemphigus with Rituximab: Real-Life Experience in a Cohort of 117 Patients in Israel. https://pubmed.ncbi.nlm.nih.gov/33567432/ Accessed November 8, 2025
- Page Not Found. https://www.cdc.gov/vaccines/programs/vfc/about/index.html Accessed November 8, 2025
- 404 Page Not Found. https://www.ama-assn.org/practice-management/digital/issue-brief-telehealth-cost-savings-potential Accessed November 8, 2025
- Page Not Found. https://www.cdc.gov/tobacco/quit_smoking/how_to_quit/index.htm Accessed November 8, 2025
- Error. https://www.nihcm.org/categories/chronic-disease Accessed November 8, 2025
- Just a moment.... https://jamanetwork.com/journals/jama-health-forum/fullarticle/2817245 Accessed November 8, 2025
- 403 Forbidden. https://www.cancer.org/research/acs-research-highlights/cancer-disparities-research-highlights.html Accessed November 8, 2025
- Just a moment.... https://jamanetwork.com/journals/jamanetworkopen/fullarticle/2823114 Accessed November 8, 2025
- Page not found. https://www.chcf.org/publication/health-disparities-race-ethnicity-california/ Accessed November 8, 2025
- Just a moment.... https://jamanetwork.com/journals/jama-health-forum/fullarticle/2814527 Accessed November 8, 2025
- Just a moment.... https://jamanetwork.com/journals/jama-health-forum/fullarticle/2823825 Accessed November 8, 2025
- How Americans View Use of AI in Health Care and Medicine by Doctors and Other Providers. https://www.pewresearch.org/science/2023/02/22/60-of-americans-would-be-uncomfortable-with-provider-relying-on-ai-in-their-own-health-care/ Accessed November 8, 2025
- Page Not Found. https://www.cdc.gov/pcd/issues/2024/24_0251.htm Accessed November 8, 2025
- Journal of Medical Internet Research -. https://www.jmir.org/2024/1/e52012/ Accessed November 8, 2025
- Health Information National Trends Survey. https://hints.cancer.gov/ Accessed November 8, 2025
- Study reveals wearable device trends among U.S. adults. https://www.nhlbi.nih.gov/news/2023/study-reveals-wearable-device-trends-among-us-adults Accessed November 8, 2025
- 403 Forbidden. https://www2.deloitte.com/us/en/insights/industry/health-care/wearable-technology-health-care-uses.html Accessed November 8, 2025
- What to Know About Medicare Coverage of Telehealth. https://www.kff.org/medicare/issue-brief/what-to-know-about-medicare-coverage-of-telehealth/ Accessed November 8, 2025
- Page not found. https://www.ncqa.org/news/ncqa-study-finds-overall-costs-are-similar-for-telehealth-and-in-person-care/ Accessed November 8, 2025
- Home. https://www.cms.gov/ Accessed November 8, 2025
- Page Not Found. https://www.cdc.gov/chronicdisease/about/index.htm Accessed November 8, 2025
- Noncommunicable diseases. https://www.who.int/news-room/fact-sheets/detail/noncommunicable-diseases Accessed November 8, 2025
- Page Not Found. https://www.cdc.gov/pcd/issues/2024/23_0407.htm Accessed November 8, 2025
